Instructions
- STEP 1: Make connections by dragging nodes from aparatus to the circuit.
- STEP 2: Check your connections by clicking on the ‘CHECK’ button.
- STEP 3: Set the values of resistances R1, R2 & R3 by adjusting the sliders on left, these values will remain constant throughout the experiment.
- STEP 4: Click on the ‘Power’ button to turn on the power supply.
- STEP 5: Now, vary the voltage value by moving the voltage slider to the right side, the readings on the ammeter will change accordingly.
- STEP 6: Click on the ‘ADD’ button to add the readings to the observation table.
- STEP 7: Repeat steps 6 and 7 until we reach to the 6th reading (Minimum reading to be taken to plot the graph is 6).
- STEP 8: To Verify the KCL, Compare the theoretically calculated values with the practical one.
- STEP 9: Click on the ‘PLOT’ button to display the graph.
- STEP 10: Click on ‘PRINT’ button to take out the print of the page.
- STEP 11: Click on ‘RESET’ button to refresh the page.
-
(a) Connect power supply to the circuit (1-9, 2-10).
(b)Connect ammeters (3-11, 4-12) and (5-13, 6-14) and (7-15, 8-16) or you can connect any ammeter to any resistance in circuit.
(c) Click on the label to delete all the connections for the corresponding nodes.
Instructions
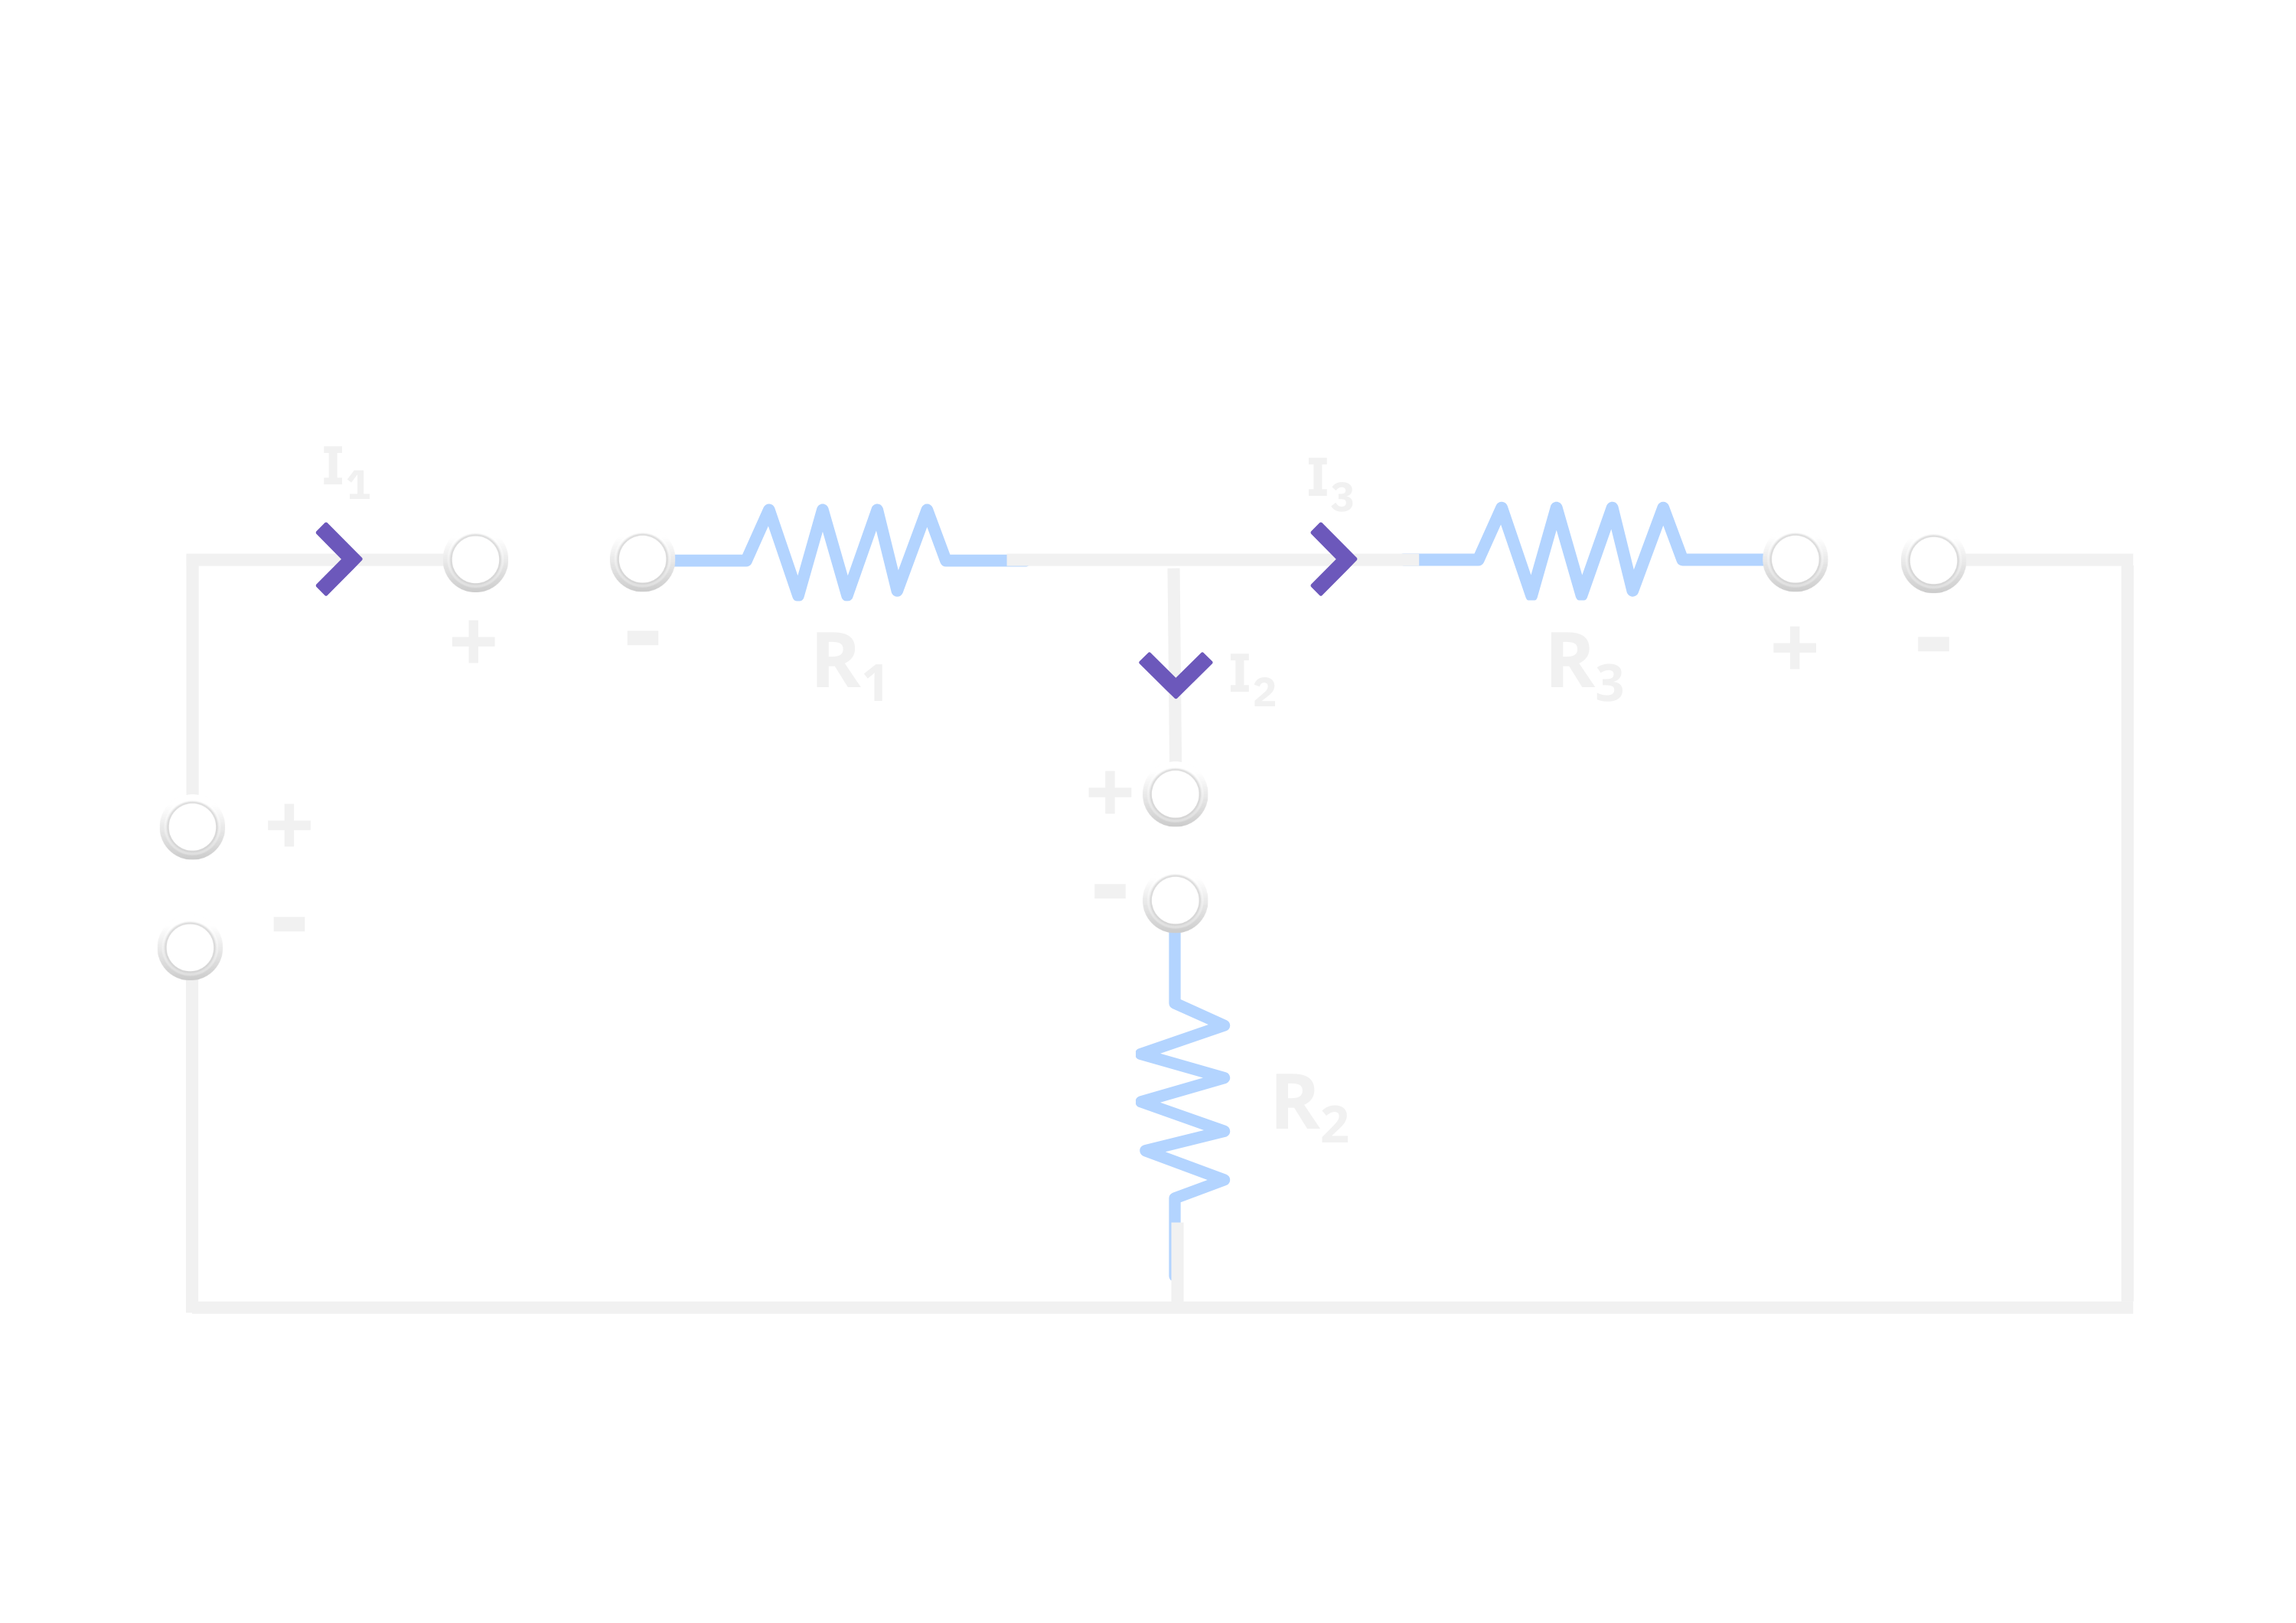
TO VERIFY KIRCHHOFF'S CURRENT LAW


OBSERVATION TABLE
| S.No | Voltage(V) | I1(A) | I2(A) | I3(A) |
|---|
GRAPH